
GE 7F.05 Gas Turbine
Project type: Enterprise Application // Employer: GE Power
Product: Advanced Modeling Platform (AMP)
AMP: Redesigning a Financial Forecasting Tool
Improving efficiency, reducing errors, and rebuilding trust in GE Power’s modeling platform
THE CHALLENGE
GE Power’s forecasting tool (used to model billing, outages, and parts flow for $35B in turbine service contracts) was outdated and inefficient. Modelers relied on manual workarounds, Excel exports, and external systems just to update a model. This slowed operations, introduced errors, and eroded confidence in the platform.
Goal: Modernize the tool to streamline workflows, reduce errors, and restore trust.
THE BUSINESS GOALS
Cut operations and maintenance costs through better modeling and scenario planning
Improve modeler efficiency by 25% (reduce margin review cycles by two weeks)
Minimize modeling errors and manual workarounds
THE DESIGN APPROACH
We grounded the redesign in principles that matched how modelers think and work:
Clarity: Meaningful labels and logical structure aligned to mental models
Efficiency: Fewer steps for margin review and centralized external data
Discoverability: Key data visible, scannable, and actionable
Consistency: Material Design and Angular Material for a scalable system
MY ROLE
As Lead Product Designer, I owned the end-to-end UX process:
Understand: Stakeholder interviews, modeler observations, workflow mapping
Analyze: Identified friction points and defined future-state flows
Design: Led design studios, created prototypes, design system components, and high-fidelity UI
Validate: Planned and facilitated user testing and synthesized insights into refinements
THE UX PROCESS
Each 2 to 4 week sprint followed a consistent and iterative cadence:
Define user and business requirements
Observe real modeling workflows
Synthesize findings into opportunities
Ideate and prototype solutions
Validate with users and refine
Hand off designs for development
This structured approach turned a complex, error-prone system into a more intuitive and efficient forecasting tool. It improved productivity and strengthened trust across GE Power’s operations.
“With our current tools, it is nearly impossible to deliver a well thought out financial model in just a few days.”
— Mahesh A., OTR Modeler
“We have to provide quick cost analysis to create ideal outcomes for both GE and our customers.”
— Lisa L., ITO Modeler
OLD PRODUCT
ICAM: Infrastructure Contractual Agreement Modeling

NEW PRODUCT
AMP: Advanced Modeling Platform


Remote observations via Skype were necessary because our users were spread across three continents.

Scripted discovery questions prior to help guide the users through the observation sessions.
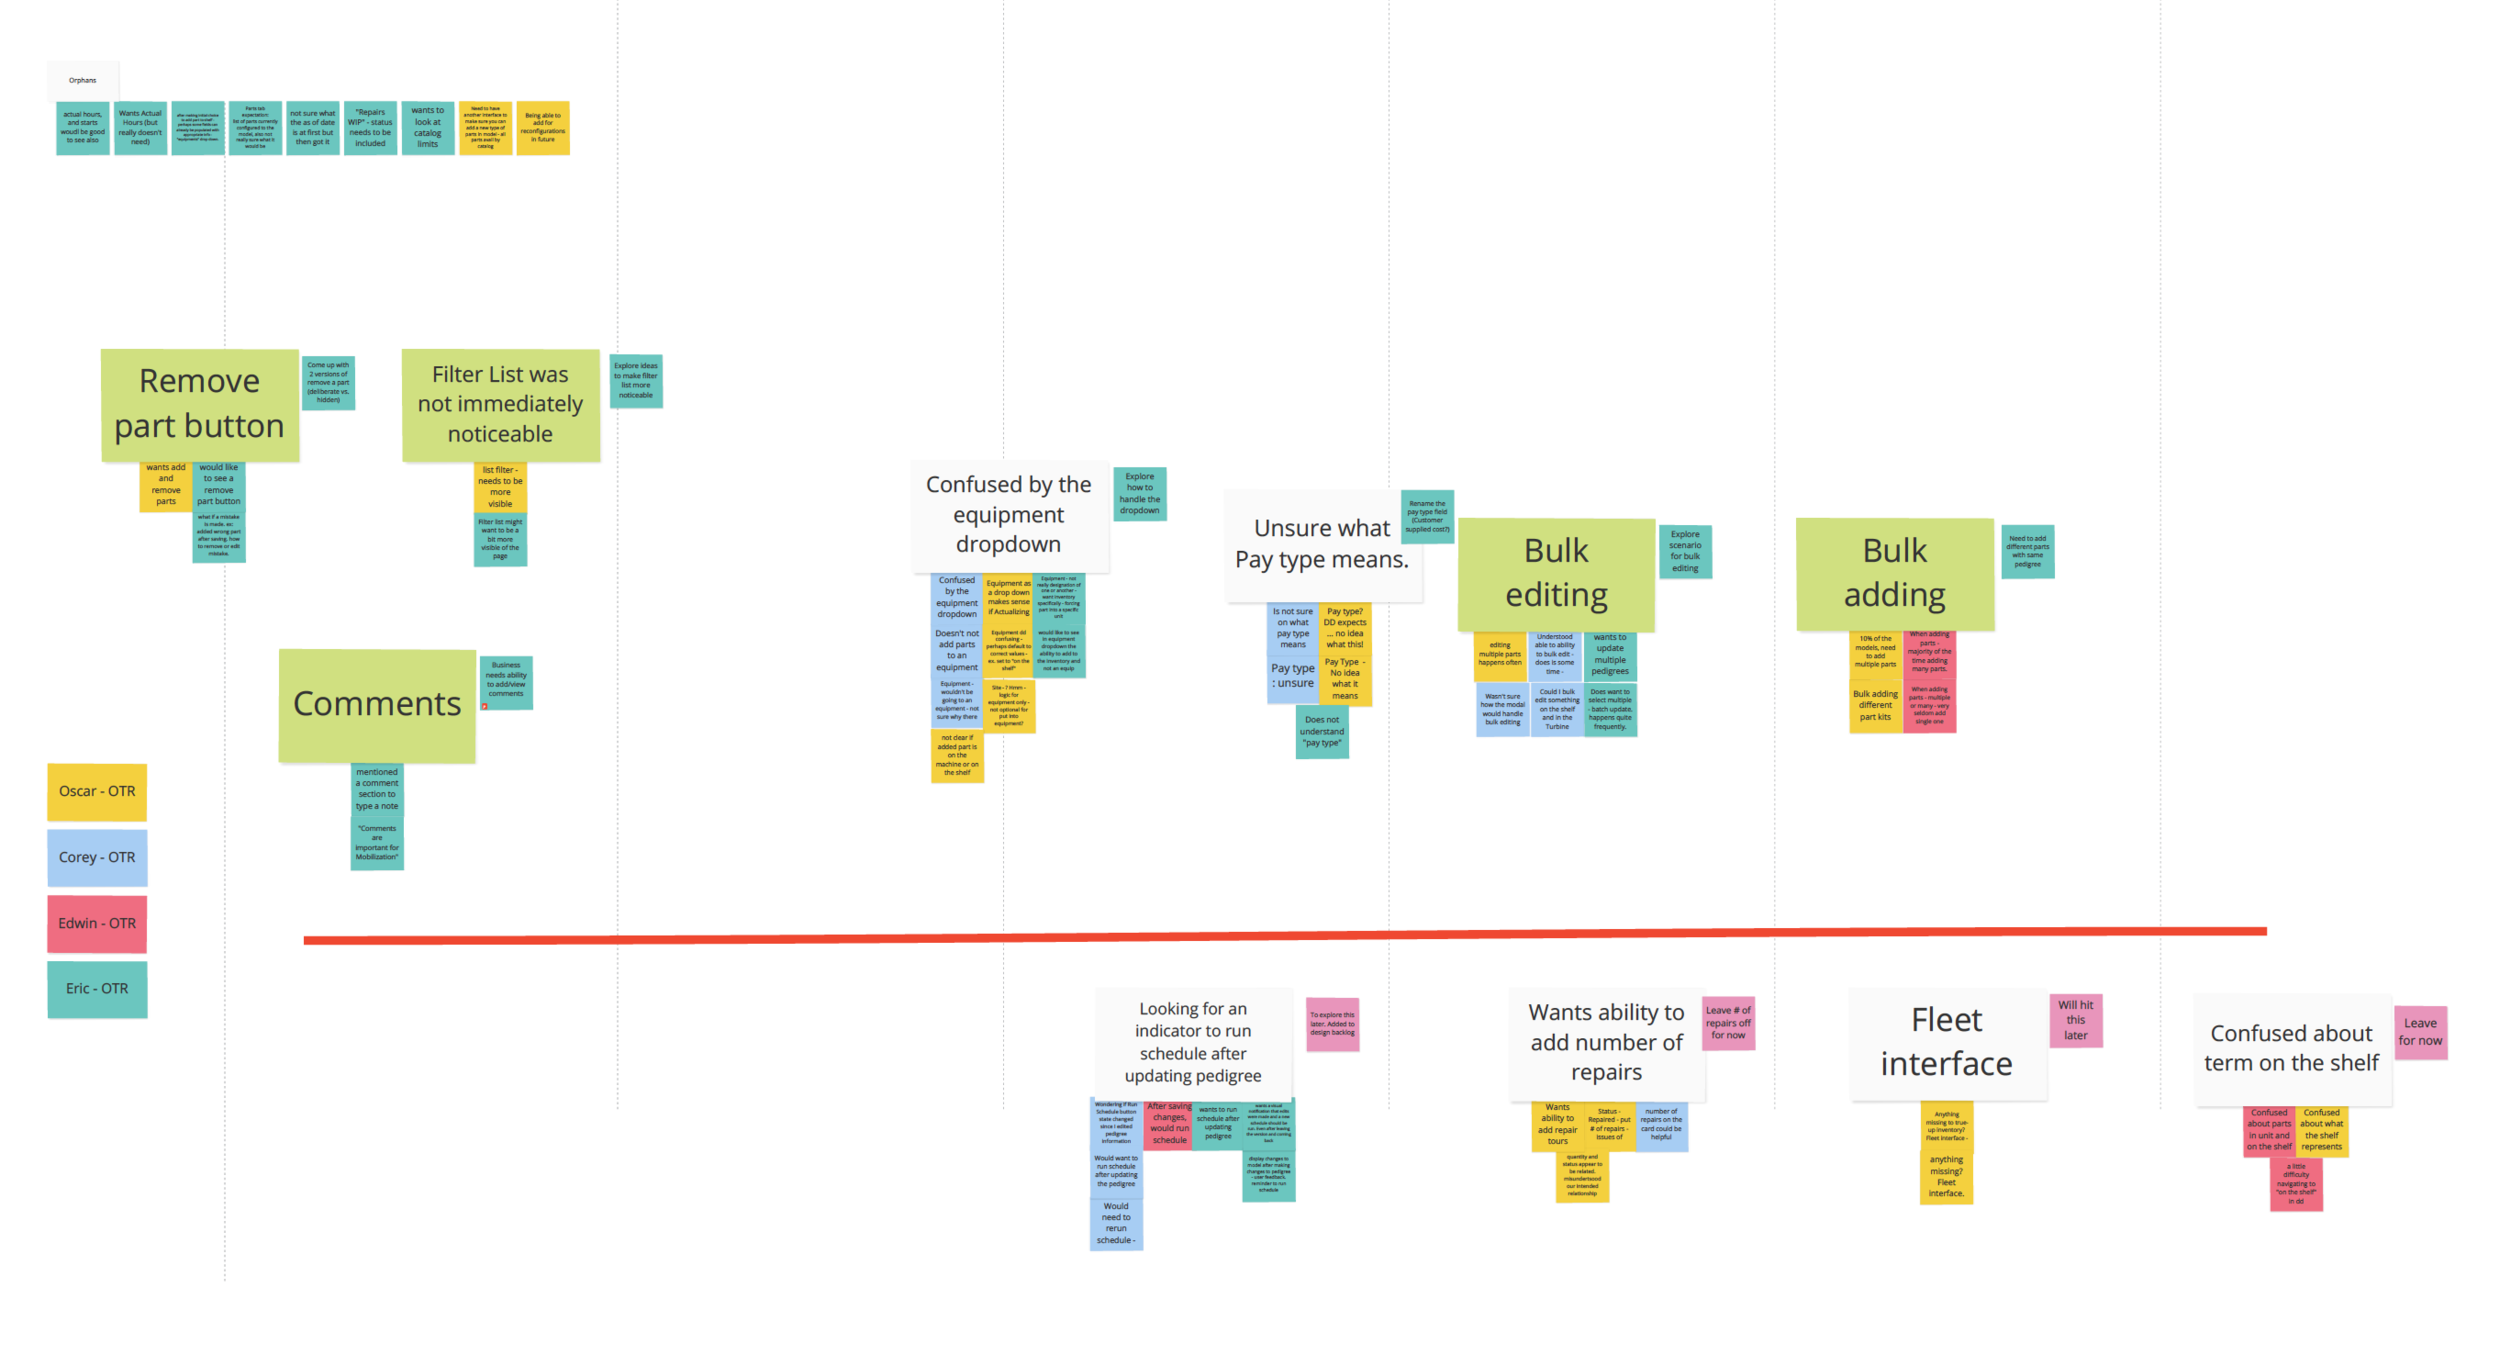
Prioritization exercise via Miro Board

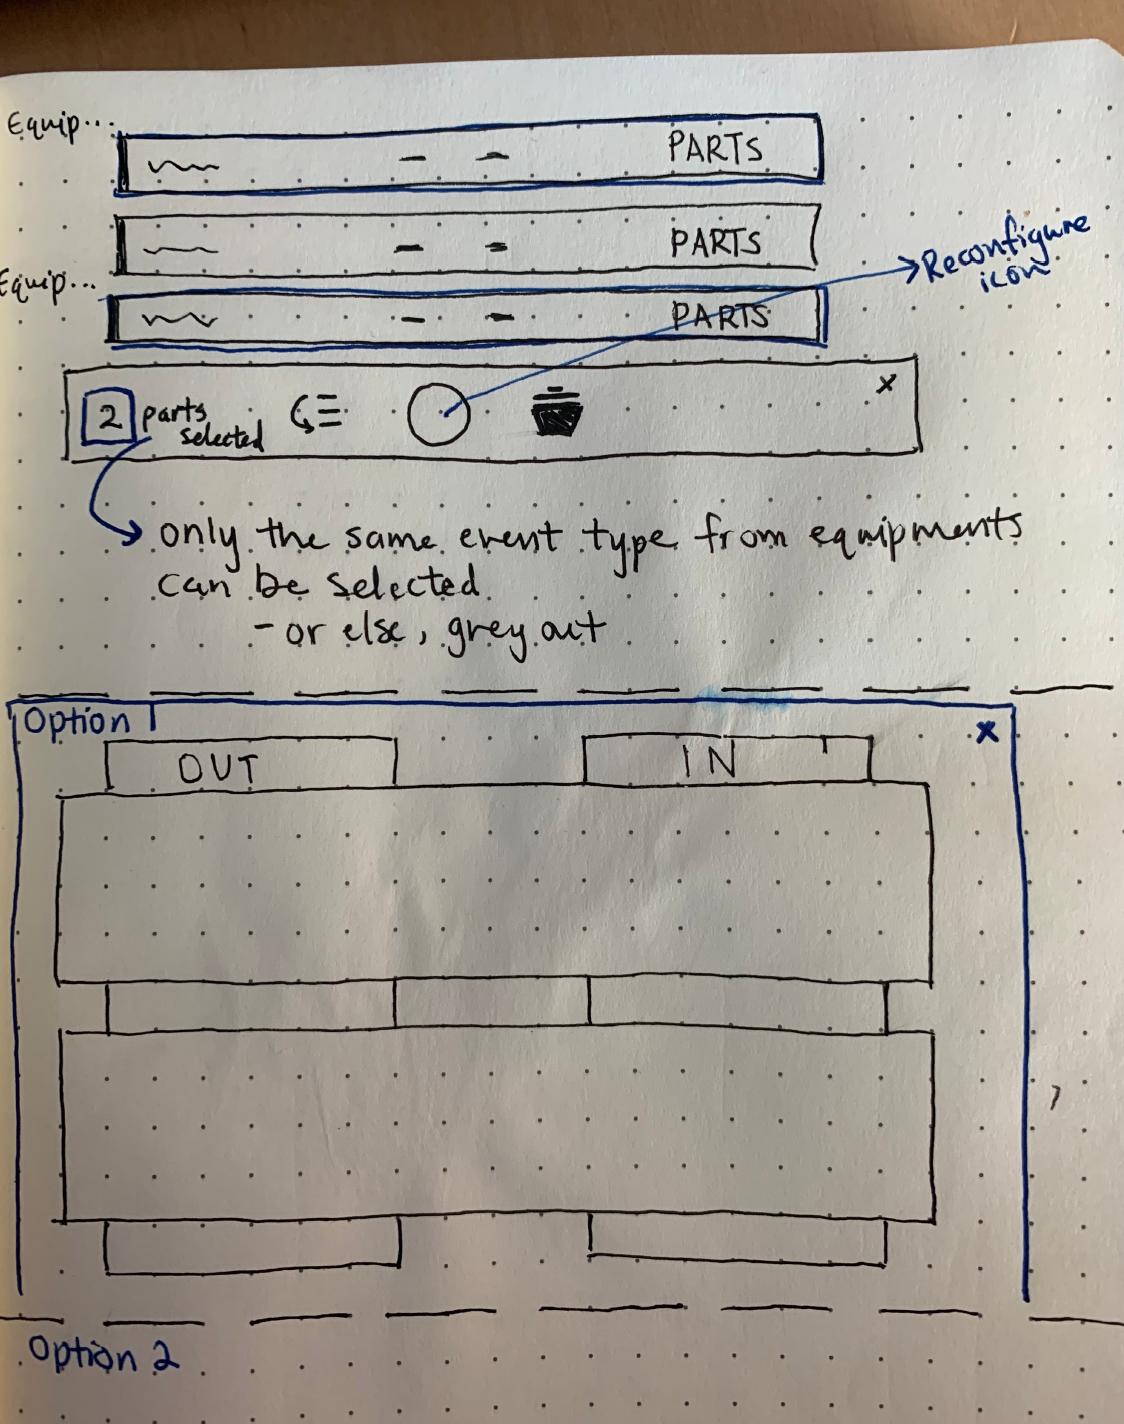


Facilitated sketching exercises based on observation results with engineers and product managers to foster cross-discipline collaboration.


Usability test (InVision) for projected manual variable billing scenario.
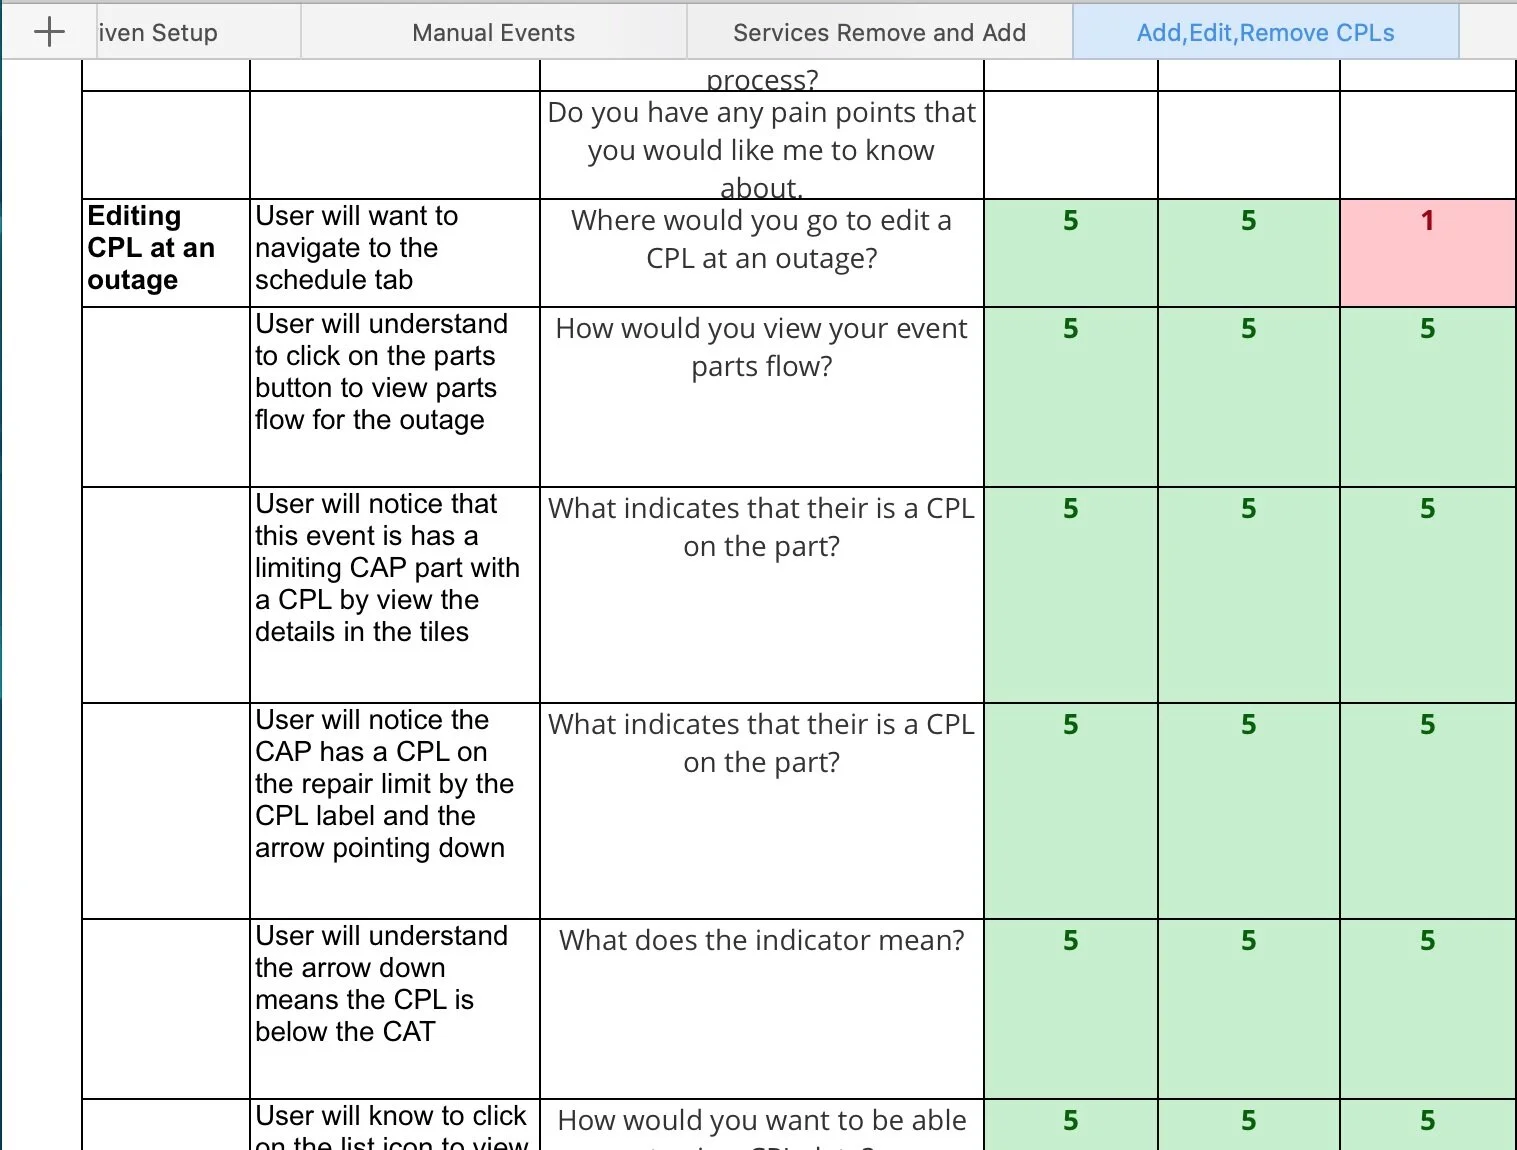
Example assumptions and questions document used during usability testing.
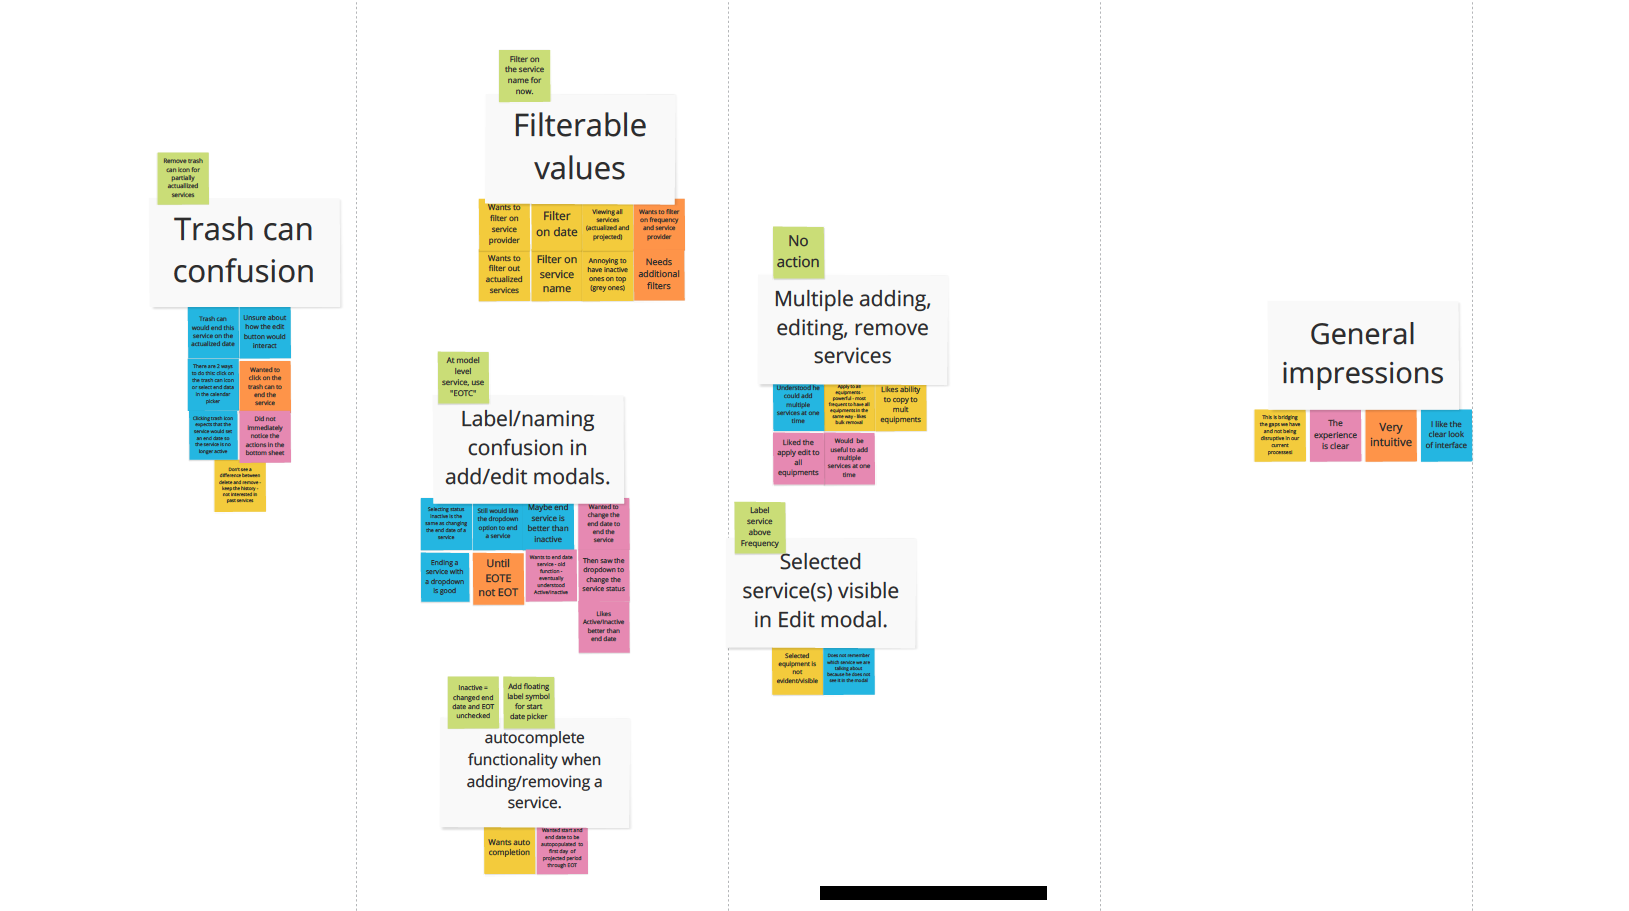
Prioritization exercise via Miro Board
Sample screen designs

Operational Data, monthly view

Billing Setup, Op data range billing

Billing Totals, model view